

The pipeline you can't see (Yet)
Your dashboard shows 30% of your pipeline. The other 70% just became measurable.

The CMO Freeze
Monday morning, you open your CRM and more than half the pipeline sits under “direct” or “organic”. Deals you can’t trace, can’t explain, can’t defend at the next QBR.
This is the scene we see with a lot of CMO we sit down with, and the sequence that follows rarely varies. The CMO freezes, can’t justify the spend, and ends up retreating to “brand” as the catch-all explanation. The CFO doesn’t buy it, budget comes under pressure, and a quarter later someone else is writing the marketing plan (feels familiar?!).
When I asked Dave Gerhardt on the podcast if he works on attribution, his answer was “Fuck no.” Fair enough — Dave runs a media company, sells to his own audience, and owns his P&L. If you report to a board, though, “Fuck no” is not a line you can take to the CFO on a Wednesday 😅
Truth is, the dark funnel stopped being a measurement problem a while back; it’s now a behavior problem. Most of the 70% is now measurable — if you know where to look. The 72% number we’ll open with is where that starts.
The 72% Gap
Two CMOs, same market, same budget.
1️⃣ The first one opens her CRM on Monday, sees paid search at the top of the list with 28% of trackable pipeline, and doubles the paid budget for Q2. The numbers say so — case closed.
2️⃣ The second one does something much smaller. She adds a single field to every form: “How did you hear about us?” Three months later, she compares the two data sets line by line. Her CRM still says paid search, but her buyers are telling a different story — “your CEO’s LinkedIn post,” “the podcast episode with [expert],” “a peer mentioned you in a Slack group.”
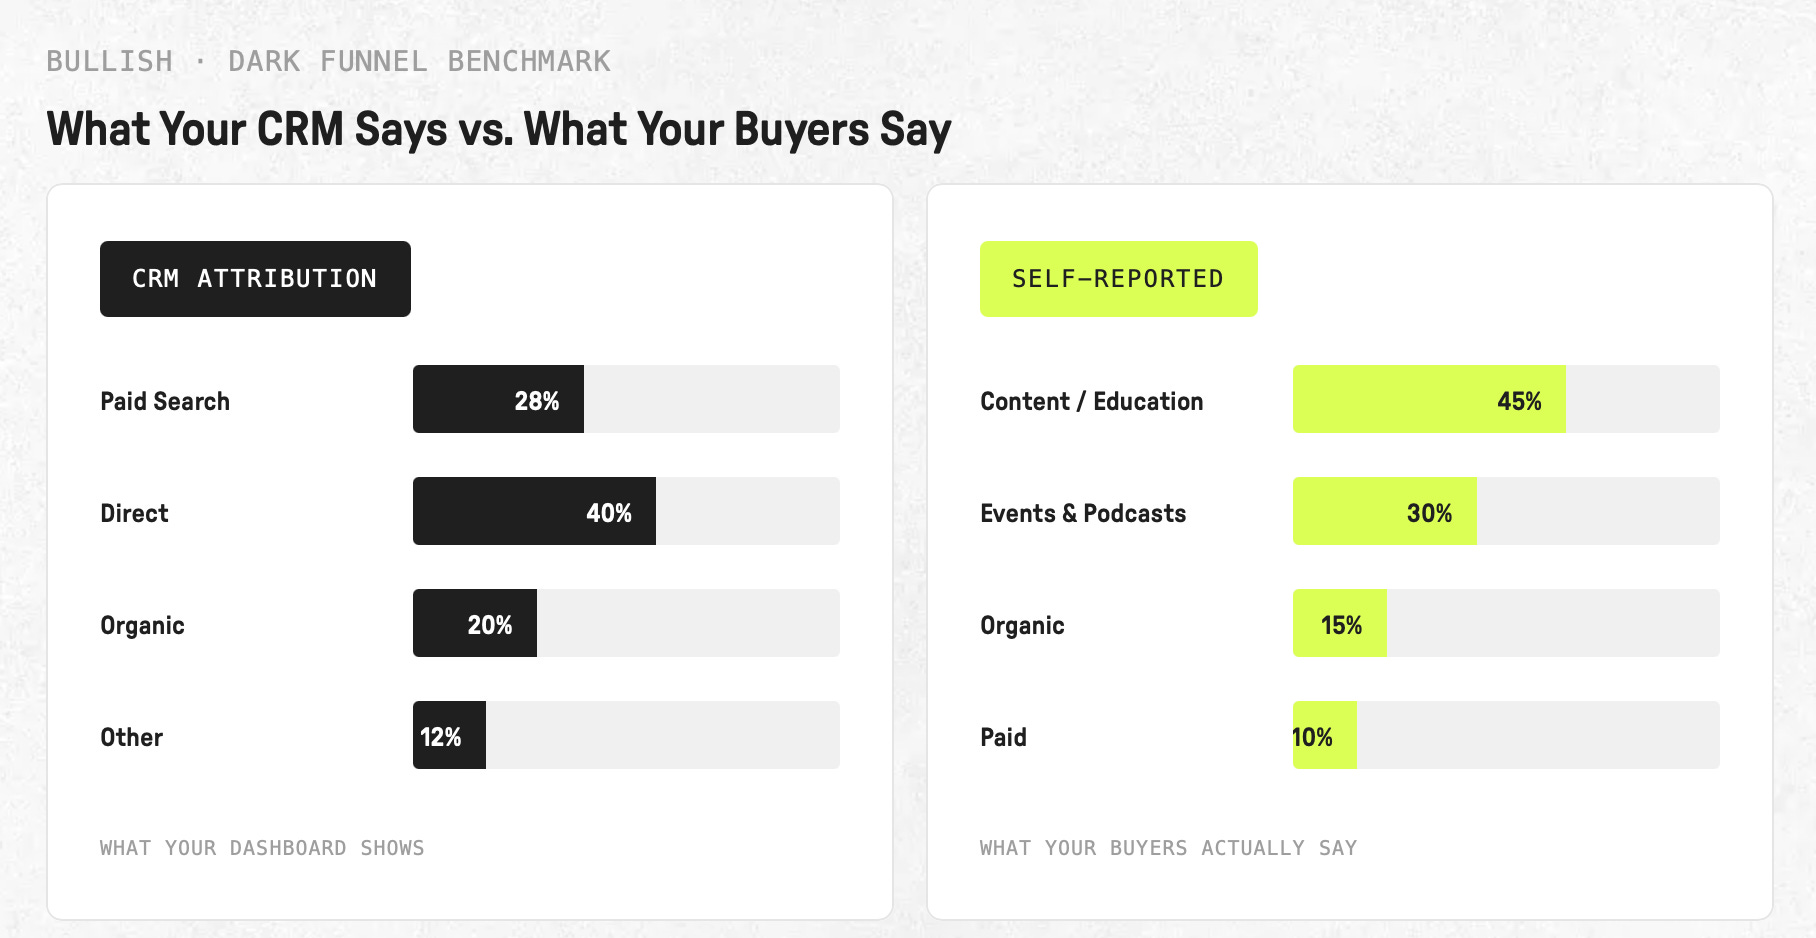
At Bulldozer, 72% of our inbound leads report discovering us through LinkedIn or a podcast, and our CRM calls that exact same traffic “direct” or “organic.” The gap between what the system records and what the buyer actually remembers is massive, and we’re not an outlier — Refine Labs pegs it at 62% of closed-won revenue misattributed, HockeyStack sees 55-65% of pipeline stuck in the dark, and Dreamdata found 75% non-attribution on deals above $100K. For enterprise cycles, three-quarters of the pipeline shows up as a ghost.
Then the math gets worse. Alice de Courcy, who took Cognism from €3M to near €100M ARR, ran the comparison side by side and found 25 demo requests close one deal, while 100 content leads close one deal — at half the average contract value. The pipeline your CRM sees isn’t just the wrong pipeline; it’s also the cheaper one. You’re paying to measure the deals that are worth the least.
The Three Dark Zones
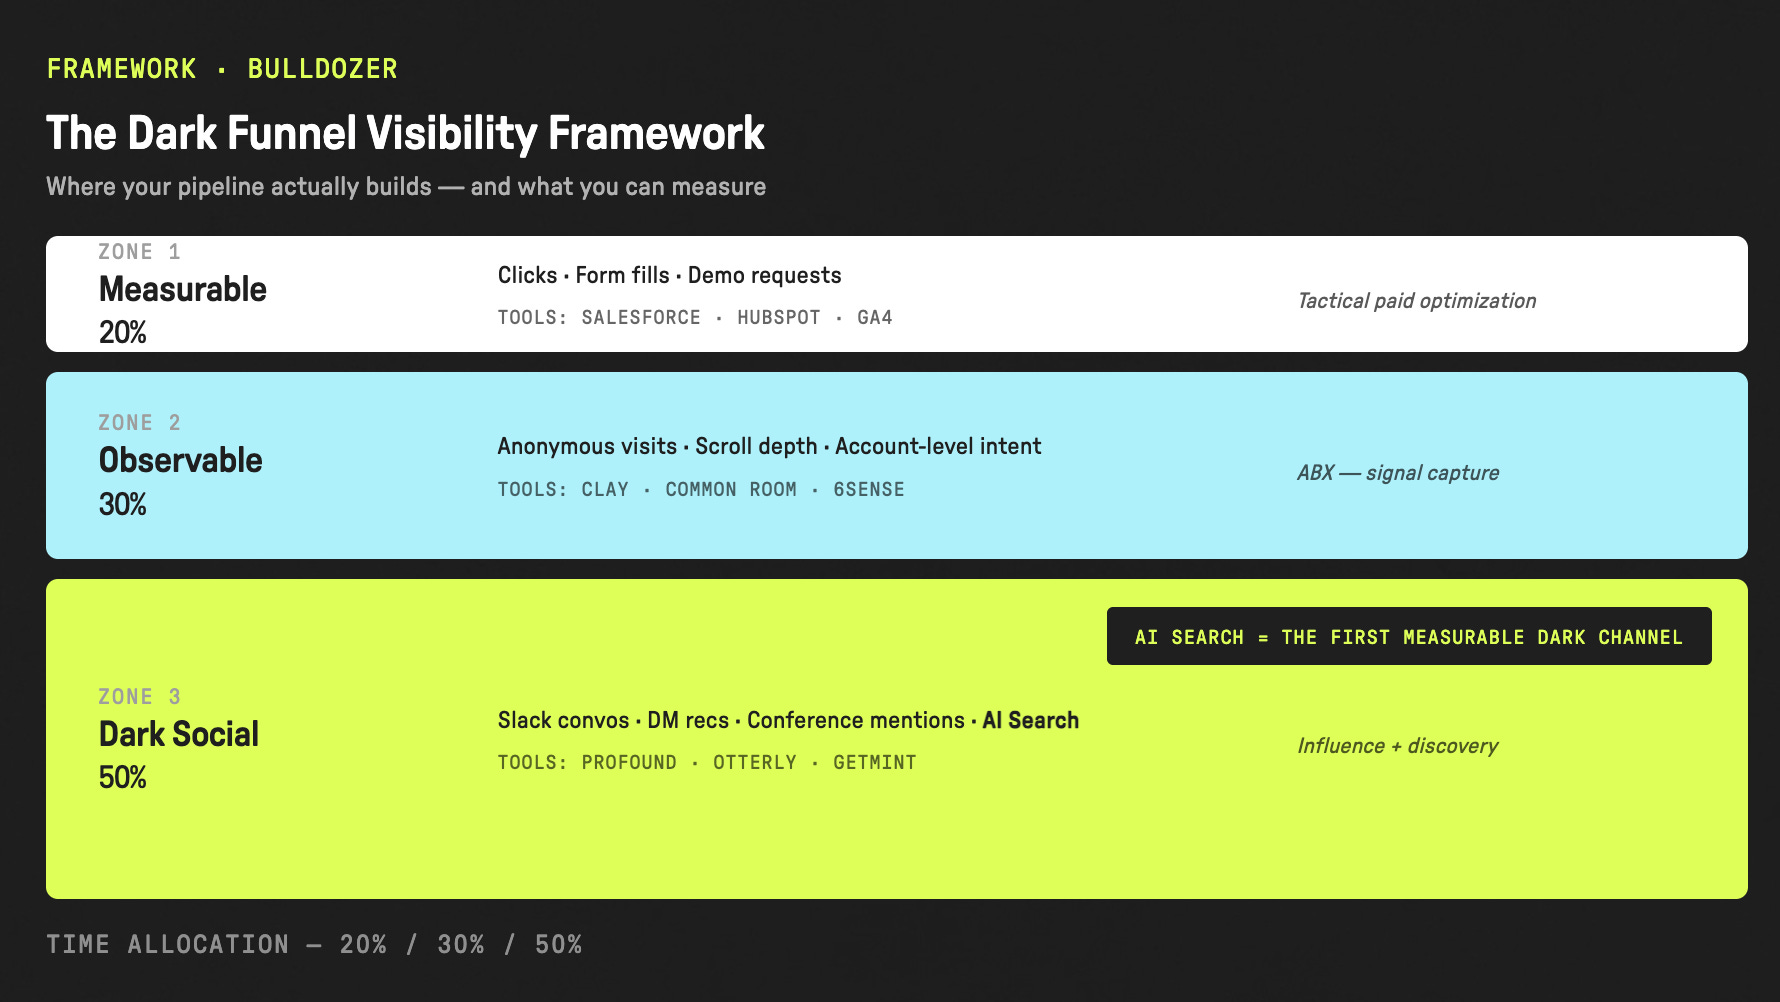
The dark funnel isn’t one thing — it’s three zones, and each one needs a different play.
Zone 1 — Measurable (20%).
Clicks, form fills, demo requests. Classic attribution works fine here, and it’s genuinely useful for tactical paid decisions, campaign tests, and creative selection. What it’s not useful for is justifying your total budget — you’d be explaining one-fifth of reality and calling it the full story.
Zone 2 — Observable (30%).
This is the zone most teams are blind in by choice, because it produces signals rather than leads — anonymous visits on the pricing page, scroll depth on comparison content, repeat LinkedIn engagement from the same account, downloads with no conversion attached…
This zone is the core of what we do at Bulldozer in ABX: we capture signals through Clay for real-time enrichment, score accounts and lead-level intent, and trigger outreach when the time is right. What’s hard is that you stop hunting leads to convert and start identifying accounts that entered an active research phase six to nine months before they’ll ever speak to sales.
By the time they reach out, you’re already on the shortlist, and 95% of the time the vendor on the shortlist on day one is the vendor that wins.
Zone 3 — Dark Social (50%).
Slack conversations, peer DMs, mentions in private communities, recommendations over coffee at a conference — historically impossible to track. This is where the narrative used to stop with a shrug: “accept that you won’t see it.”
That stopped being true in 2026. Zone 3 picked up a new dominant contributor this year — AI search — and it’s the first piece of the dark social you can actually measure.
73% of B2B buyers now use LLMs during their purchase research, but only 11% of domains appear in both ChatGPT and Perplexity (Averi.ai, 2026) — each model has its own citation graph.
More striking: only 10% of AI citations overlap with page-one Google results, which means 90% of AI visibility is completely untouched by classic SEO. Content older than 30 days gets 3.2x fewer citations, and AI-referred visitors convert 3-5x better than traditional organic (Source : Seer Interactive) — with Claude-referred traffic closing at 16.8% and ChatGPT-referred at 15.9%.
One counter-intuitive note worth holding in your head: being cited is not the same as being chosen. 40% of buyers remember a brand as “one of several options,” and only 26% remember one as the primary recommendation. LLM visibility is necessary, not sufficient — brand still does the closing.
The 90-Day Visibility Sprint
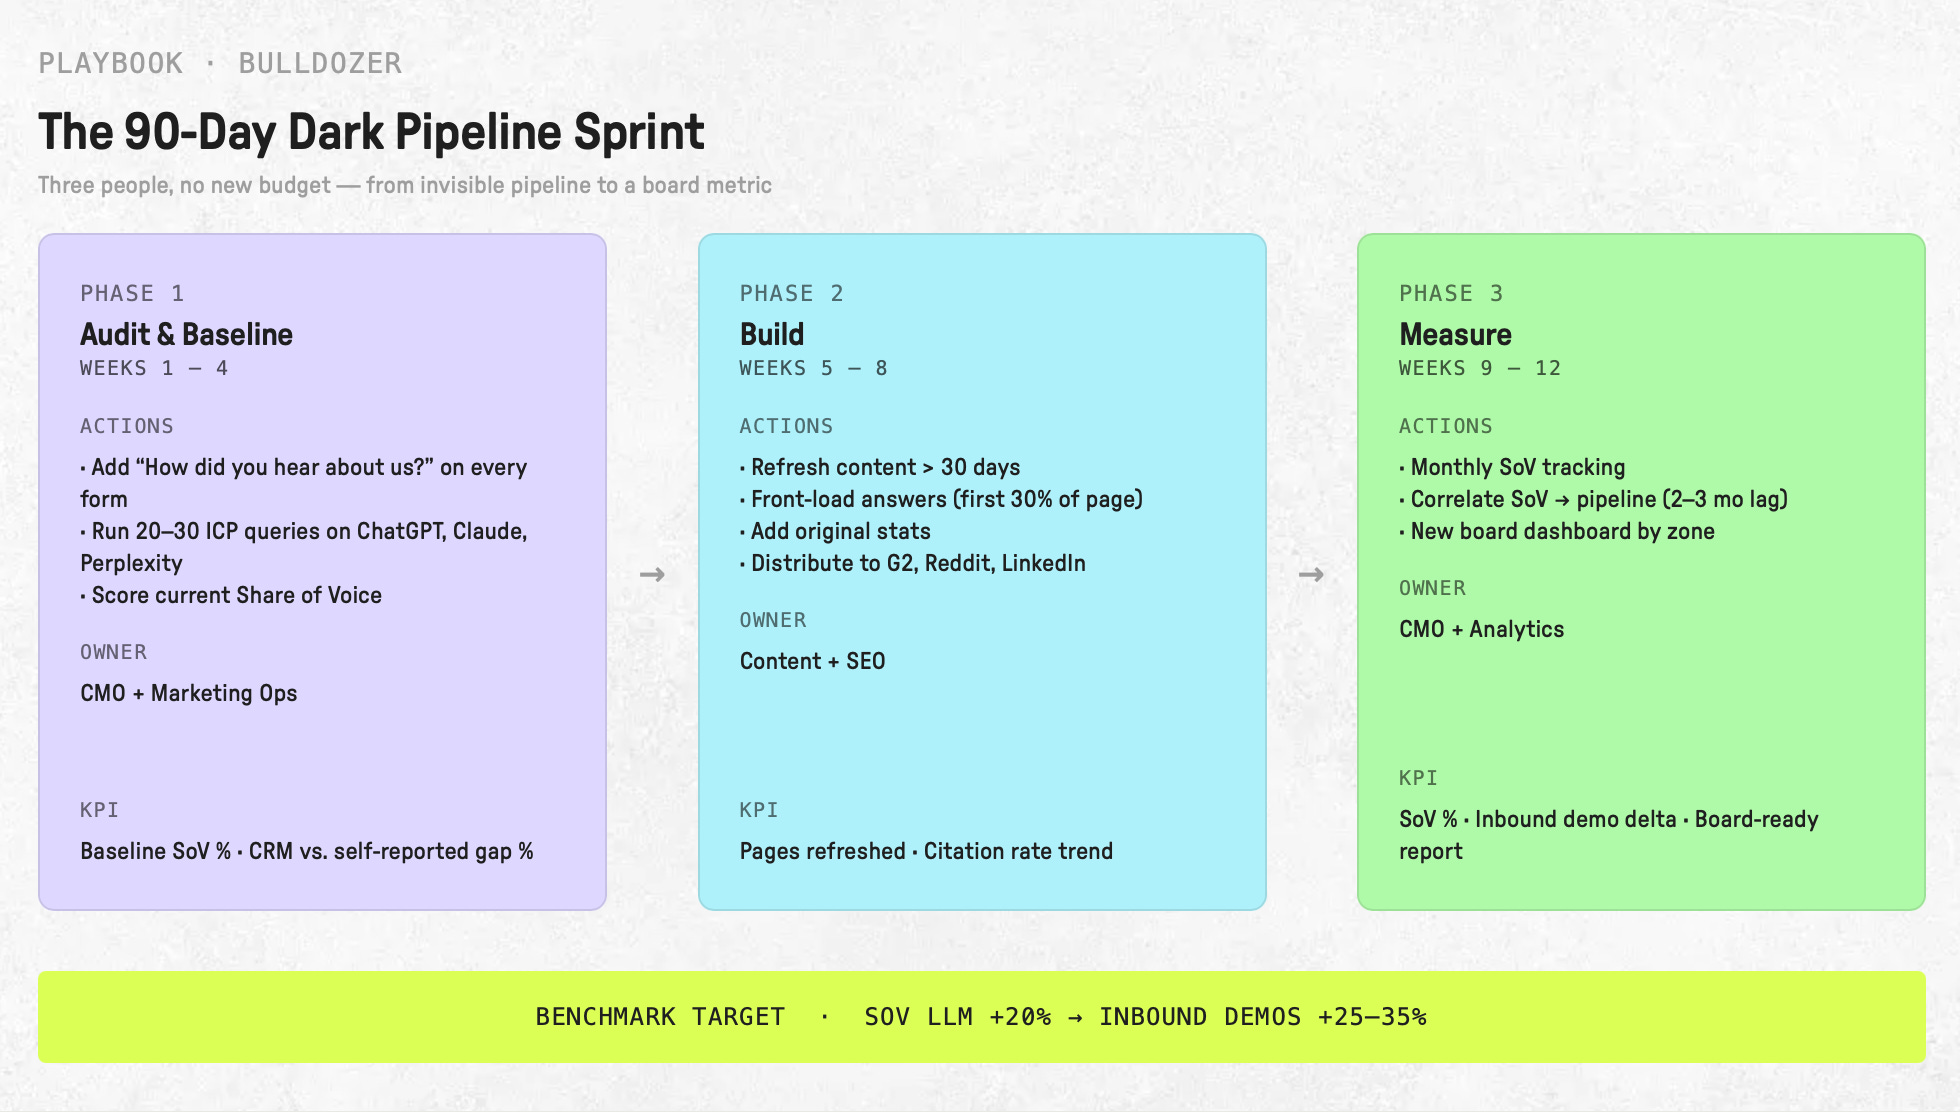
Three people, no new budget, twelve weeks. Here’s the sequence we run with clients.
Strategic moves (1-3).
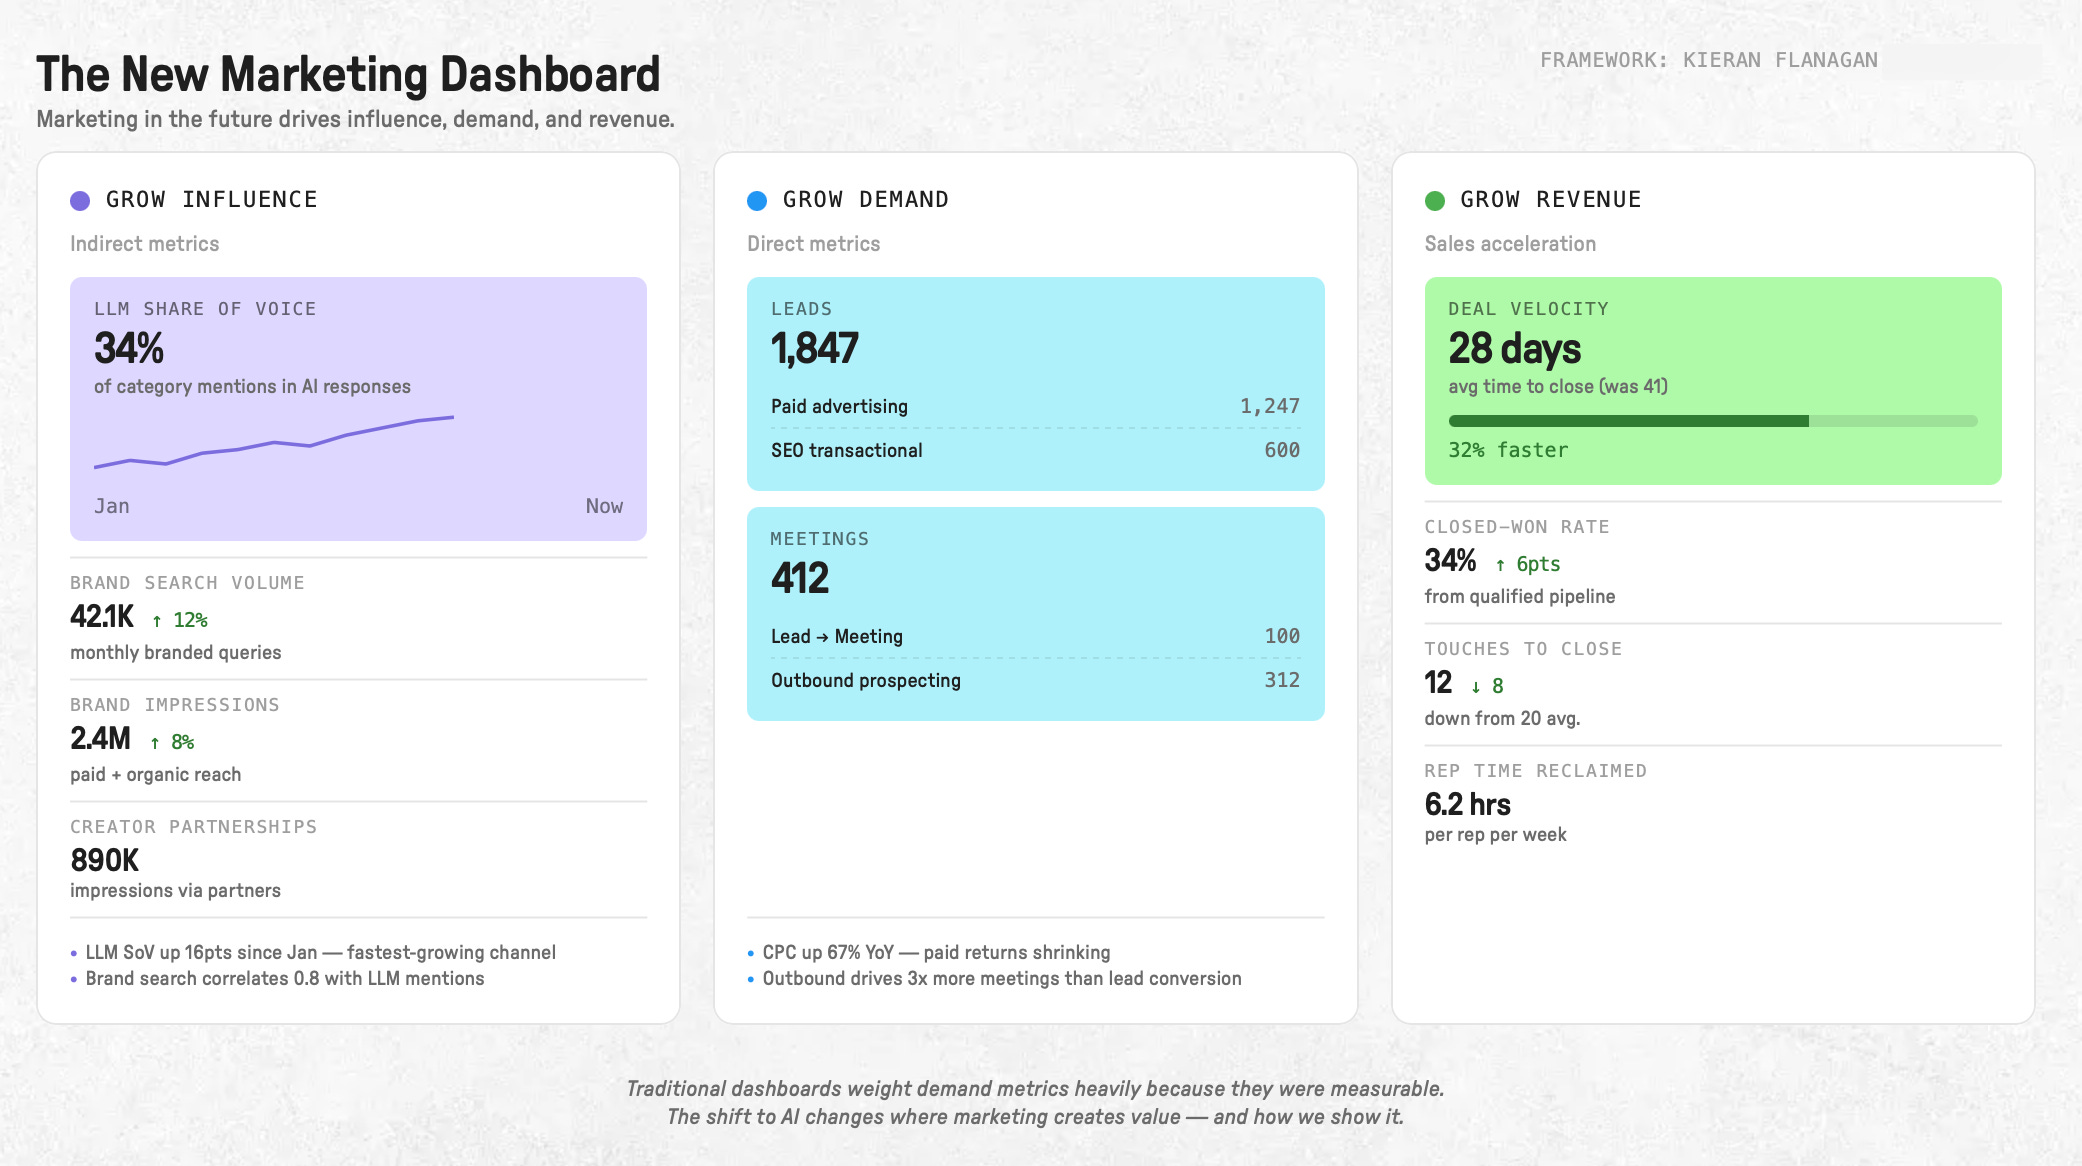
Report by zone, not by channel. Build a three-column dashboard: Influence (what’s growing future demand), Demand (what’s converting now), Revenue (what’s closing). Kieran Flanagan, has shared the cleanest version I’ve seen — Grow Influence puts LLM Share of Voice as a top-line metric alongside brand search and brand impressions, Grow Demand tracks leads and meetings, and Grow Revenue tracks deal velocity, close rate, and touches to close. The CFO reads column two, the board reads column one, and you cover both without lying about attribution.
Reallocate time (not just budget). 20% on measurable (paid, tactical), 30% on observable (ABX, intent capture, account plays), 50% on dark (brand, content that circulates, AI visibility). Most teams invert this ratio and then wonder why they plateau.
Make Share of Voice in LLMs a board metric. Not a marketing KPI — a revenue metric tracked monthly and correlated with inbound demos at a 2-3 month lag. What we’ve seen with our clients: SoV up 20% tends to produce inbound demos up 25-35% one quarter later. So that’s a pipeline predictor :)
Operational moves (4-6).
Self-reported attribution, this week. Add “How did you hear about us?” on every form, export quarterly, and compare to CRM line by line. The gap you find is your “observable dark funnel”.
AI visibility audit. Pick 20-30 queries your ICP actually types, test them across ChatGPT, Claude, Perplexity, and Gemini, and score each: 3 points for first mention, 2 for top three, 1 for mentioned, 0 for absent. Tools our clients use: Profound, Otterly.ai, Getmint.
AI-ready content playbook. Refresh anything older than 30 days, front-load answers (44% of citations come from the first 30% of the page), add original stats (+40% visibility lift), and distribute where LLMs actually pull from — LinkedIn captures 62% of B2B software citations, then Reddit and G2.
Advanced moves (7-8).
Correlation tracking. SoV LLM → pipeline, 2-3 month lag, monthly cadence. You now have a leading indicator the CFO will sign off on.
New board dashboard. Retire “which channel generated this deal.” Replace with “Is our total influence growing?” — five lines: SoV LLM, brand search volume, inbound demos, sales cycle length, win rate vs. top three competitors.
Your Call
Two CMOs. Same market, same budget, same team.
Twelve months from now, both of them stand in front of their board. The first explains 30% of pipeline with attribution data and hand-waves the other 70%. The second presents a framework that covers 100% — measured where it can be, flagged where it can’t, blurry but accounted for.
Only one of them still has a budget a year later.
Which one are you?
Let’s grow 👊
— Jordan
Asking direct feedbacks from clients is so important. I was working in a startup before and I made them send a simple Tally form to understand why people decided to churn. So many people are focused on datas — and don't get me wrong, it's essential and we're lucky to have so many — but let's not forget the human "signals" too. Thank you for sharing all those great insights, as always !