

AI productivity in marketing: the 3 metrics that work
Input, output, outcome. Chained.

Two weeks ago I recorded an episode of Momentum with Kieran Flanagan, SVP Marketing at HubSpot. Twenty minutes in, we landed on the same diagnosis: marketing is the only function in the company without a clean AI productivity metric.
Engineering measures lines of code shipped. Sales measures pipeline per rep. Customer support counts tickets resolved. Customer success watches account usage. Each one can correlate “% of team using AI” with a real output number, and decide whether to push further or pull back.
Marketing has… LinkedIn posts?!
This is not a small problem. Very soon, every CMO will have a quarterly board slide titled “AI productivity,” and every CFO will expect a precise number. Except today, that number doesn’t exist! And the consequences on your budget are going to hurt…
Kieran was honest: he hasn’t cracked it at HubSpot either.
So I spent two weeks cogitating, mapping what we do at Bulldozer, and rebuilding the metric from first principles. Here is where I landed.
Two companies. Same story.
Klarna, Q1 2023. About 7,000 employees. ~$1B annual revenue. Revenue per employee: about $140,000.
Klarna, 2026. About 3,000 employees. ~$3B annual revenue. Revenue per employee: about $1M.
RPE multiplied by seven in three years 😵💫
Average salary moved from $126K to $203K over the same window.
Same Klarna. More output. Fewer, better paid people.
Shopify ran the same play differently. Headcount peaked at 11,600 in 2022, dropped to 8,100 by end of 2024. Annualized revenue: $10.7B. Revenue per employee: $1.32M.
Tobi Lütke’s April 2025 memo to his team made it explicit: prove to me that AI can’t do the job you want to hire for, before asking for more headcount!
We’re watching the same mechanic at our scale at Bulldozer. The marketing team has not moved for two months. Same five people:
Charlotte on content
Paul on growth
Sylvain (SDR intern)
Enguerrand and me
In that window, monthly generated pipeline went from €1.7M to €2.4M. Up 41% in 8 weeks. No new hire.
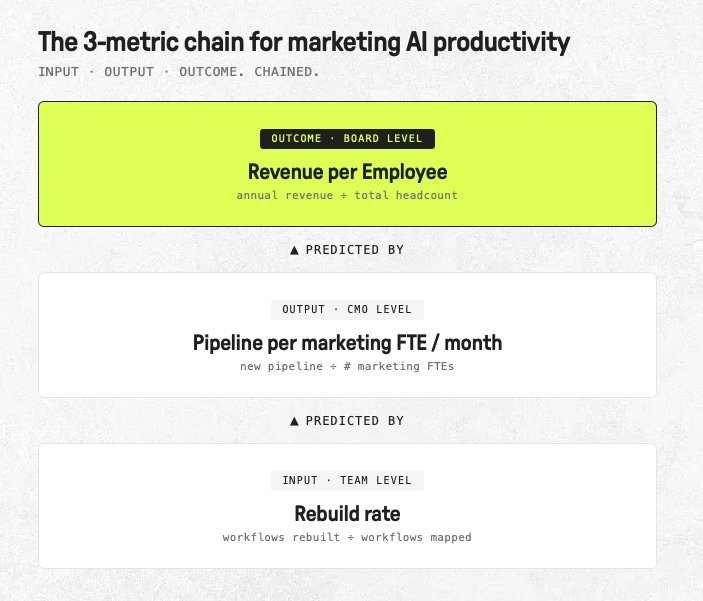
The point is not “fire your team.” The point is that Revenue per Employee (RPE: annual revenue ÷ total headcount, your CFO’s favourite ratio) is not an abstract horizon. It’s a number you can move within a quarter. Provided you have two other metrics underneath that predict it.
Three patterns we see across 50 marketing teams
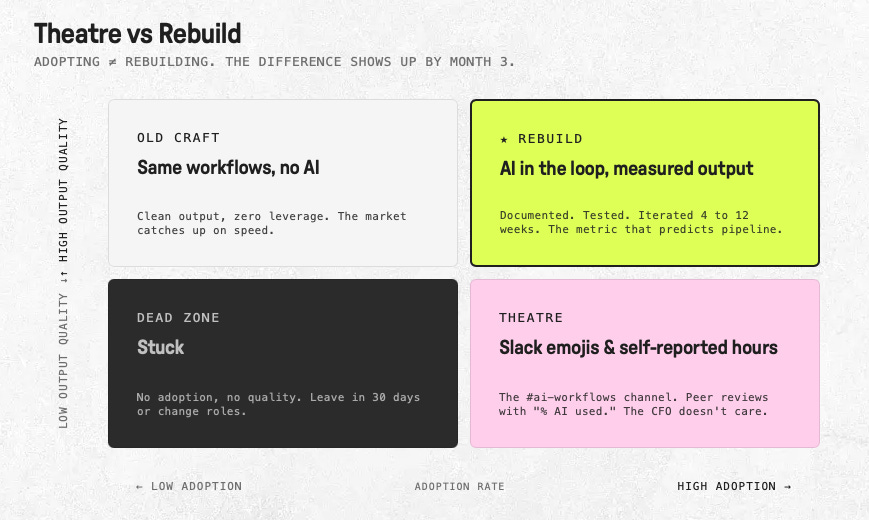
1️⃣ Adoption theatre.
A Slack channel called #ai-workflows and self-reported “hours saved this week.” The numbers look great. They map to nothing measurable downstream. Pipeline didn’t move. Brand search didn’t move.
Spoiler: the CFO doesn’t care, because a vanity metric isn’t actionable.
Be honest — you have this Slack channel too.
2️⃣ Adoption rate is not rebuild rate.
Adopting Claude is free and instant. Three clicks. Anyone can do it.
Rebuilding a workflow is something else: you map the inputs, you define the expected output, you decide where the AI sits in the loop, you test it on 5 to 10 real cases, you measure quality drift, you iterate prompts for 4 to 12 weeks until it ships.
Adoption is a checkbox. Rebuild is engineering work applied to marketing.
The two metrics often correlate negatively in month one, because real rebuild is slower than fake adoption.
3️⃣ Outcome metric measured too early.
“Revenue per Employee” drops in the first 6 months of an AI program. Always.
You’re paying for tooling, paying for prompt iteration time, your team is shipping more outputs but the quality is worse before it gets better.
CMOs who report RPE to the board at month 3 panic and cut the program.
CMOs who report “rebuild rate” at month 1 to 3, then Pipeline per Employee at month 4 to 6, then Revenue per Employee at month 7 to 9, get to ship the full program.
Sequence matters more than the metrics themselves.
The lesson is mechanical: these three metrics are not independent. They are chained in time. Mis-sequence them and you self-sabotage.
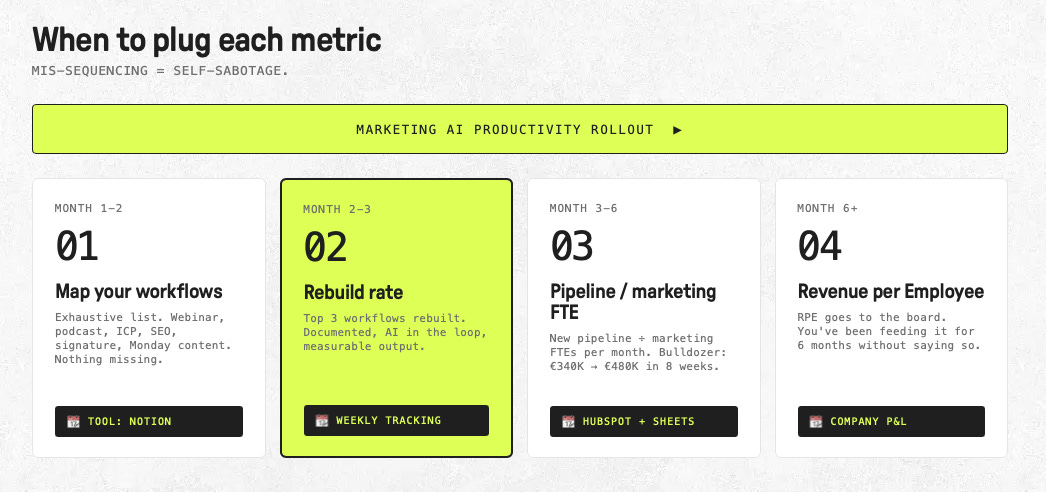
Where to plug each metric (and when)
📆 Month 1-2: map your marketing workflows. Make the list exhaustive. At Bulldozer ours runs:
webinar (announce, reminders, replay)
Momentum podcast production (transcript to derived content)
ICP and JTBD generation from sales call transcripts
SEO and GEO (audit and production)
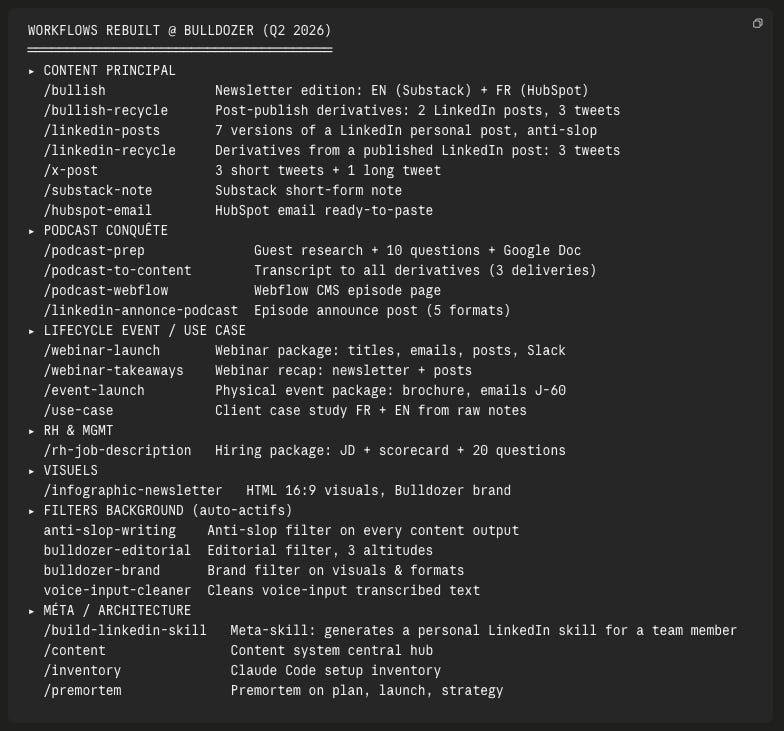
The total count is the denominator of your “rebuild rate.” Tool: Notion or a flat doc, it doesn’t matter. What matters is that nothing is missing.
📆 Month 2-3: rebuild your top three.
Not all at once. Pick three workflows ranked by frequency × value. Rebuild means documented, AI-in-the-loop, measurable output quality.
Track weekly: workflows rebuilt ÷ workflows mapped. That is your rebuild rate.
A 5-person marketing team should expect to rebuild 3 to 5 workflows in the first week.
📆 Month 3+: track pipeline per marketing FTE per month.
The formula is simple: new pipeline generated this month ÷ your number of marketing FTEs.
At Bulldozer right now: €2.4M ÷ 5 = €480K per FTE per month. Up from €340K eight weeks ago.
If your “rebuild rate” is climbing but pipeline per FTE is flat, you’re rebuilding the wrong workflows. Tool: HubSpot for pipeline tracking, Sheets or Looker for the FTE math.
📆 Month 6+: RPE goes to the board.
This is the metric your CFO and CEO are already watching. You don’t need to argue for it. You have been feeding it for six months without saying so.
If “rebuild rate,” pipeline per FTE, and the other GTM functions all moved in parallel, RPE moves in 2 to 3 quarters.
The rule is non-negotiable: never measure a layer without the one before it.
RPE without pipeline per FTE is a macro number you can’t steer.
Pipeline per FTE without “rebuild rate” is an output without a lever.
“Rebuild rate” alone is just process work.
BUT the three together form a coherent system.
Two choices, no middle ground
You walk out of your next board meeting with these three metrics on your AI productivity slide. Or your marketing team stays the only GTM function invisible in the report.
(Your CFO already has a metric for AI productivity. Yours is the one missing.)
The rebuild starts this week, or it starts next quarter.
Let’s grow 👊
— Jordan